Is there a metric out there that can encapsulate an entire building? I'm searching for it. There are several, and they each have their own weaknesses and strengths.
Building Efficiency
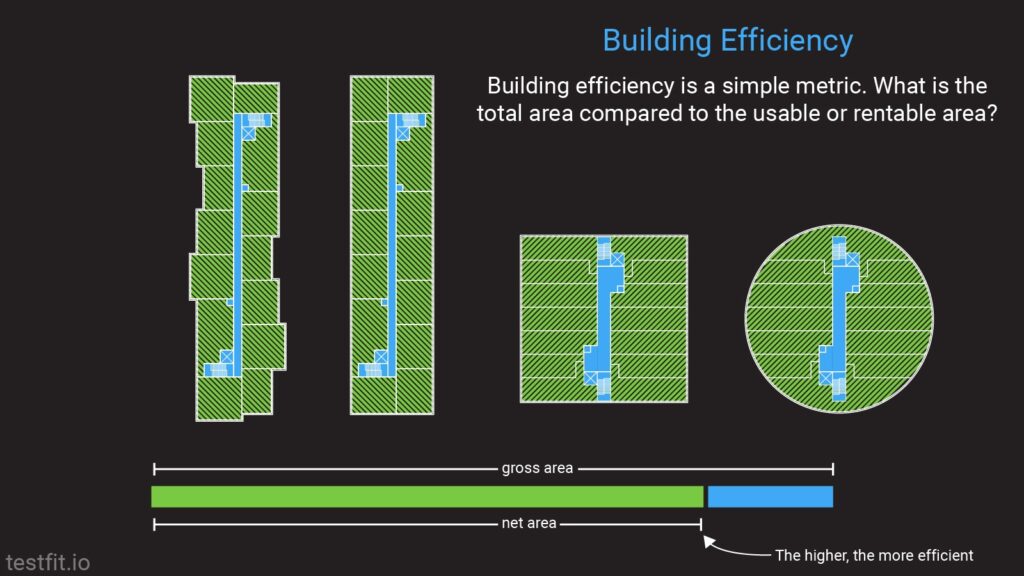
I wrote several months ago about building efficiency. It's the standard rule of thumb in the development world: how much of this building can charge rents vs how much of it is dead weight (to the pro-forma, anyway). It is not an awesome metric because it does not take into account much of the rest of the building. A corridor-heavy floor plate and a glass tower can have identical efficiencies. The metric is blind to everything except the ratio of net to gross area.
Skin-to-Gross Ratio
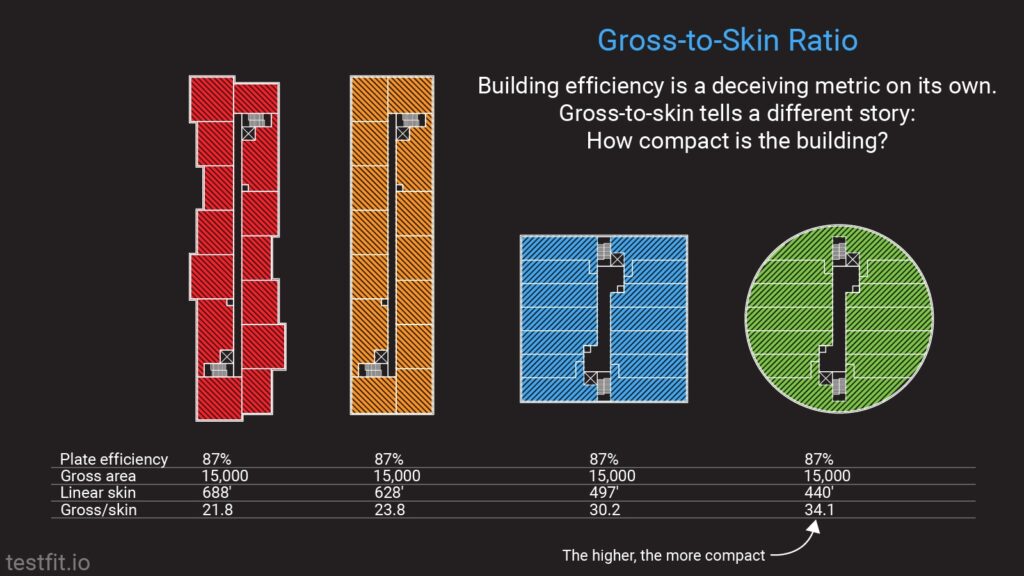
This metric takes into account what building efficiency doesn't: the building skin. Less skin, same area built, cheaper building. Right? Well, if you follow this theory to its conclusion, you end up with circular building floor plates — which are extremely hard to construct. The metric also doesn't tell you anything about the building beyond its compactness. A very compact building might be a terrible building for a dozen other reasons.
Floor Area Ratio
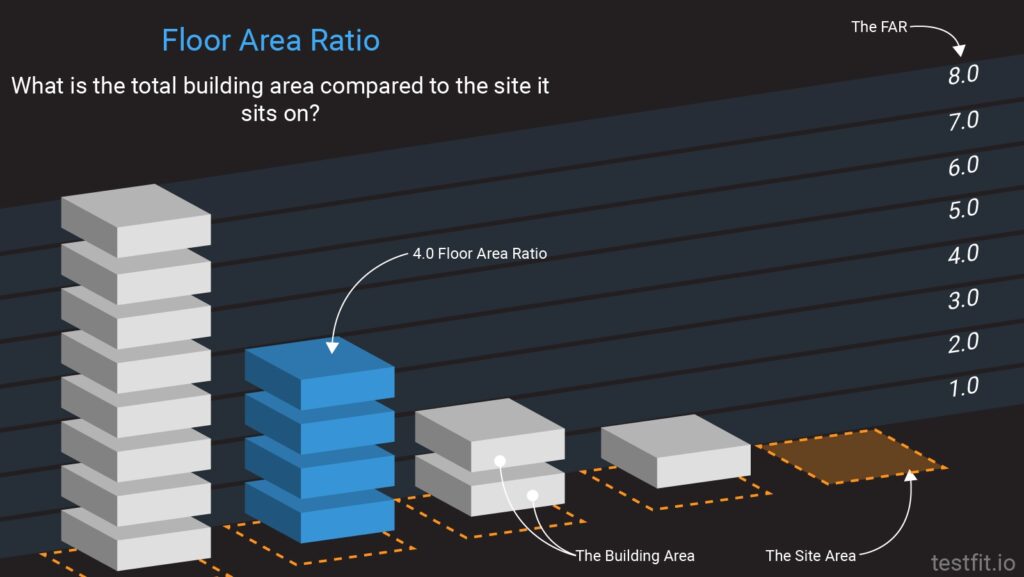
Good ole FAR. This is how city planners rein in developers: limit the FAR. But it can also be used as an analytical metric. If a building has a low FAR compared to the building next to it, there might be an opportunity to increase its intensity. It is an awful metric on its own, however — FAR cannot account for height or lot coverage. Sites governed solely by FAR are incentivized to create buildings that are as efficient as possible without any signal about how to distribute that area in three dimensions. What if you limited the net area rather than the gross? Different incentives entirely.
Lot Coverage
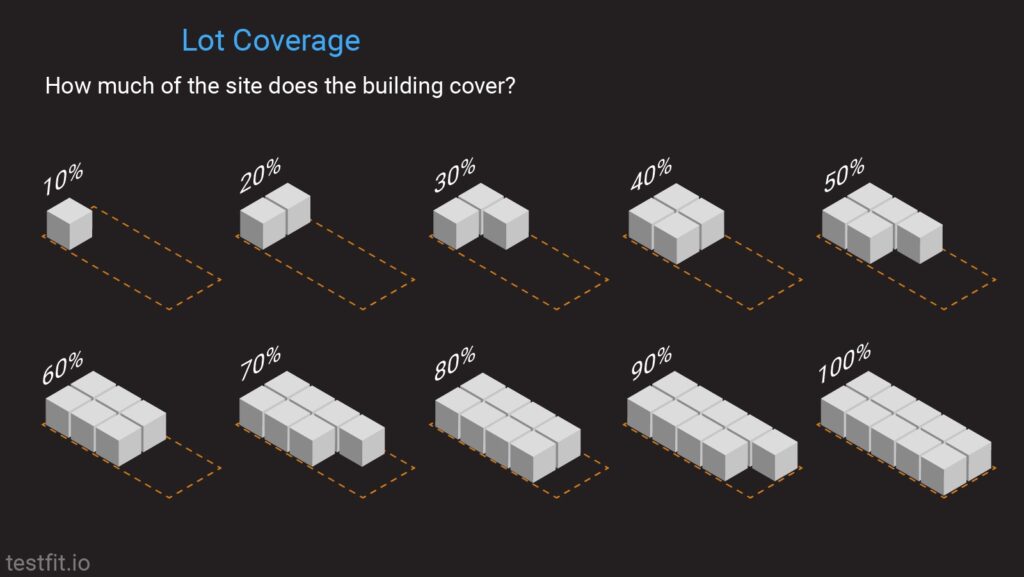
This might be the best regulation to force buildings to become taller. If a city limits lot coverage to 50%, then future developments have to go up to achieve the same intensity. This is untrue in practice, however — taller buildings are more expensive. More elevator shafts, more stairs, more structural transfer. If you tried to use lot coverage as a development metric in isolation, every developer would simply max it out. Horizontal construction is almost always easier than vertical construction. The metric is almost always gamed.
Height vs Lot Coverage vs FAR
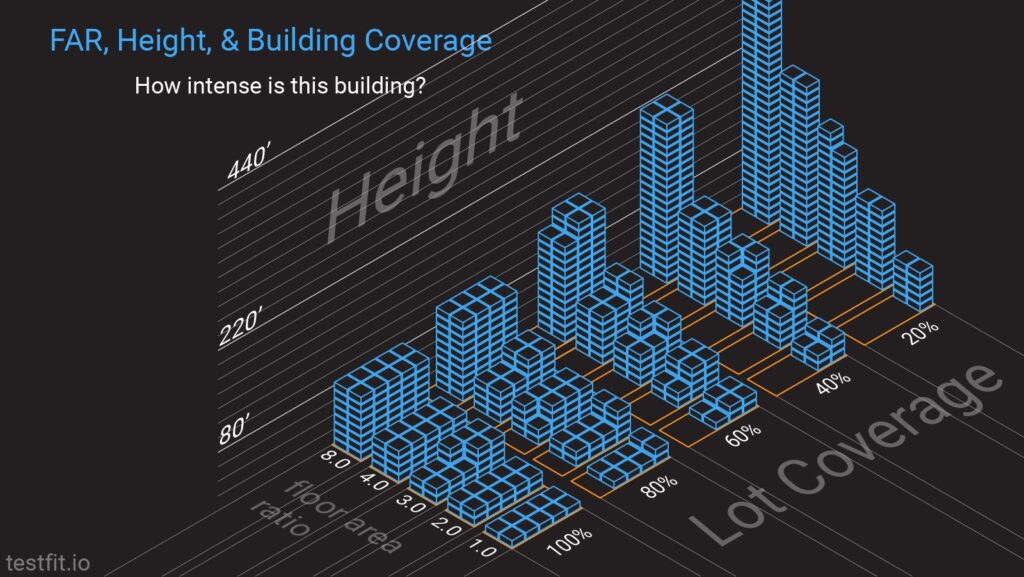
This is the best way to look at a building's performance: all three together. How tall is it? How much of the land does it actually utilize? How intense is it compared to its context? No single metric survives contact with a real site — but these three together start to paint a picture of whether a building is working hard for its land or not.
The Ultimate Building Metric
When it comes to generative design, we need to understand the performance of a design without actually needing to look at it — because we'll be searching through millions of possibilities. The five metrics discussed here are a start. But with true building optimization, future metrics will be stranger and more useful: Good View Ratio. Ease of Construction Score. Embodied Carbon per Unit. None of these are far off. The metric we haven't invented yet is probably the most important one.