This started as a dare to ourselves: could a fleet of AI agents do real land-use research — the slow, unglamorous kind that normally eats a team of analysts alive — on their own?
The answer is yes. Emphatically.
Over the last few months, autonomous agents read zoning codes, parsed building-code adoptions, chased down flaky GIS endpoints, reconciled overlays and state preemptions, and rendered the whole thing onto a single map of the country. No one hand-entered a setback table. An agent claimed a city from a queue, researched it, validated it against a schema, committed it, and picked up the next one — around the clock.
What the agents surfaced is the real story. American land-use regulation is so vast, so fragmented, and so quietly insane that no human team would ever map it by hand. So we didn’t.
What we built
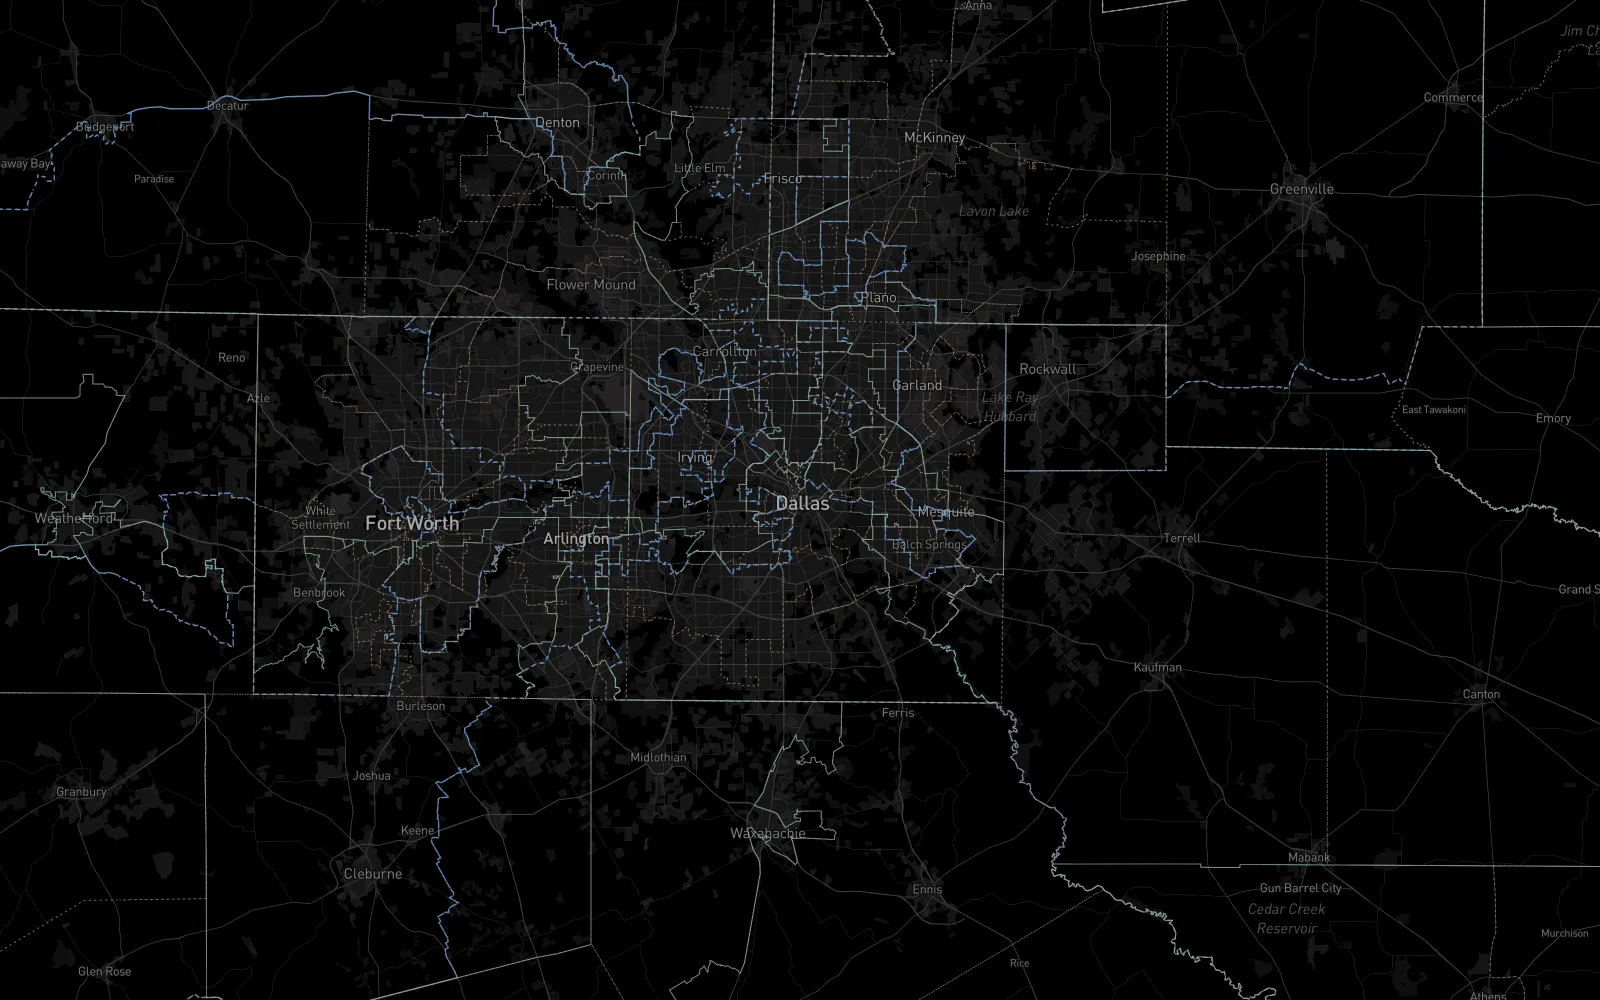
One corpus, one map. Every layer of land that matters — zoning districts, state overlays, federal overlays, hazard and equity screens, parcels, airports, the energy grid, freight, school and water districts, counties, metros, congressional lines — collected by agents and stacked on a single canvas you could pan, zoom, and click.
The tally, as of the last run:
- 1,266 cities tracked — 341 researched all the way to our deep schema.
- 51 states and 494 counties in scope.
- 684 state overlay rules and 410 preemption rules across 47 states — the places where state law quietly overrides your local code.
- 5 building codes (IBC, IRC, IECC, IFC, NEC) tracked across every state; 31 states mapped on all five.
- 172 public data sources reconciled into one catalog.
- FAA Part 77 obstruction surfaces, derived from runway geometry — because the FAA doesn’t publish them as a layer and somebody had to.
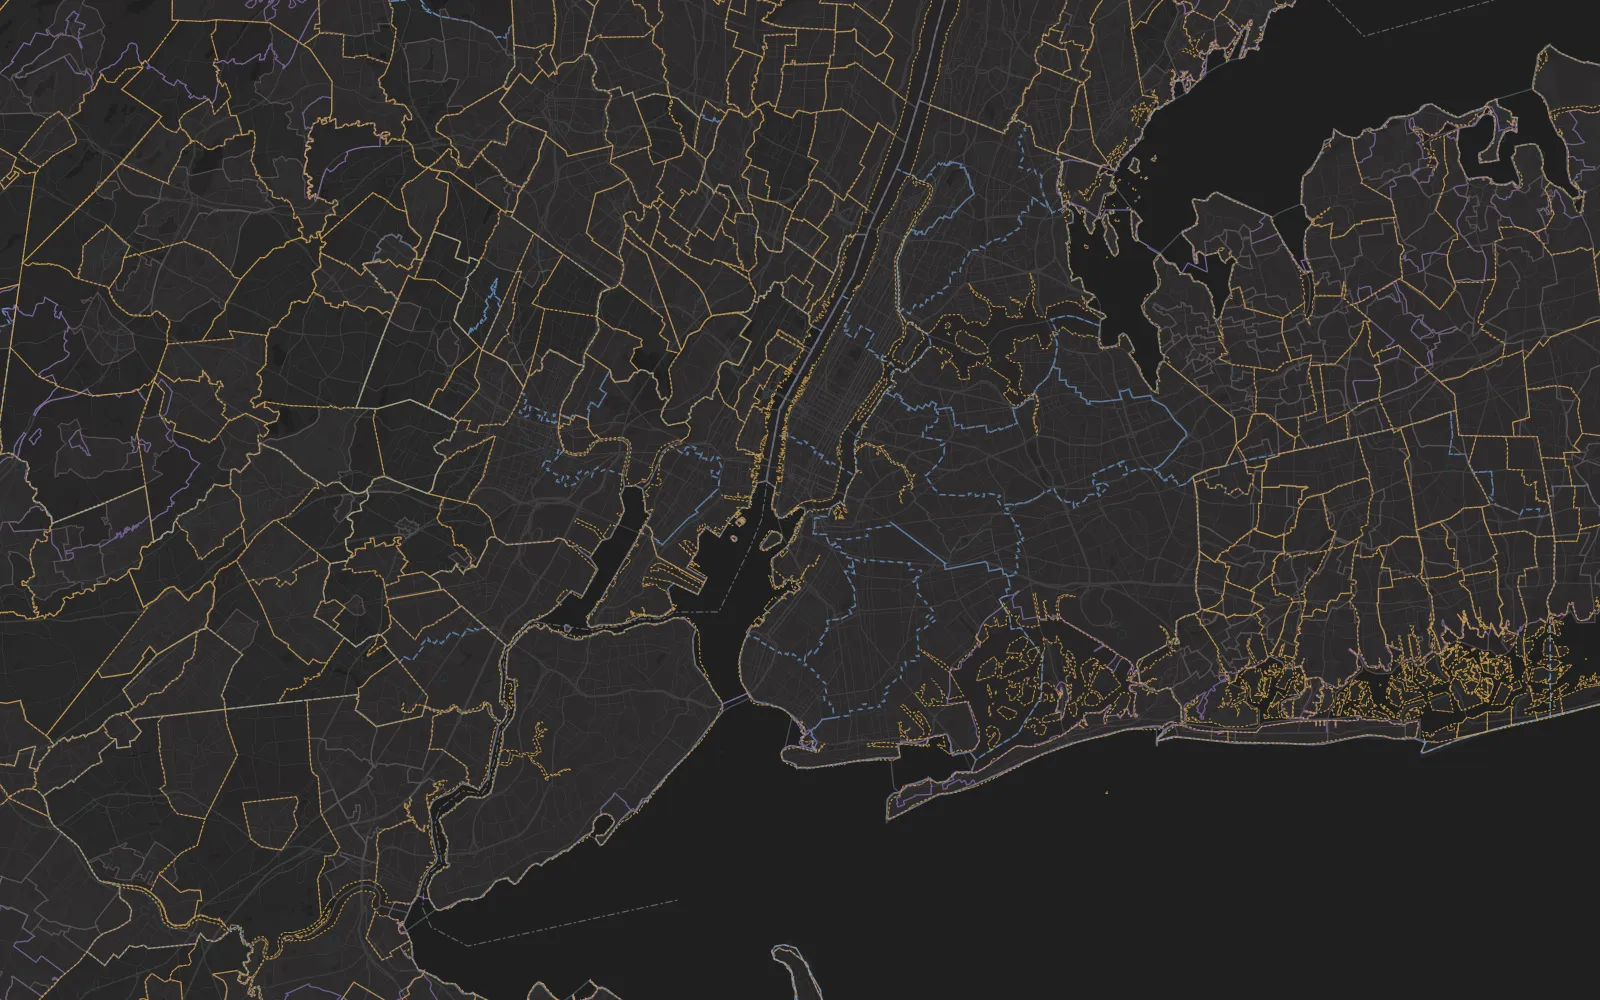
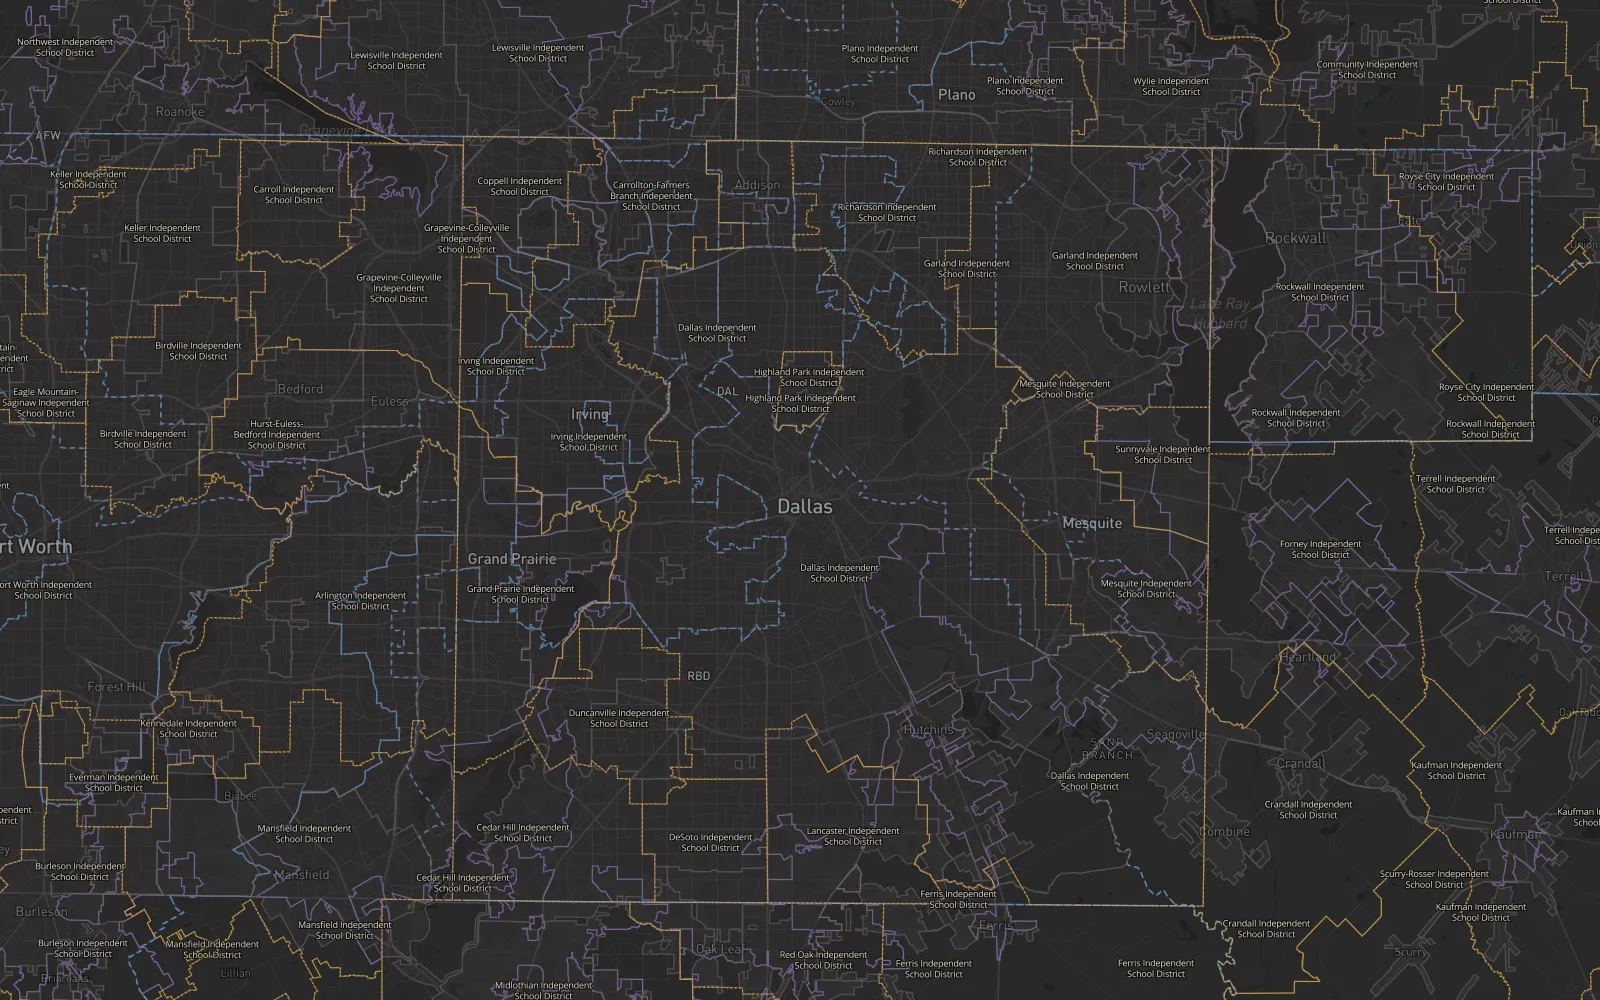
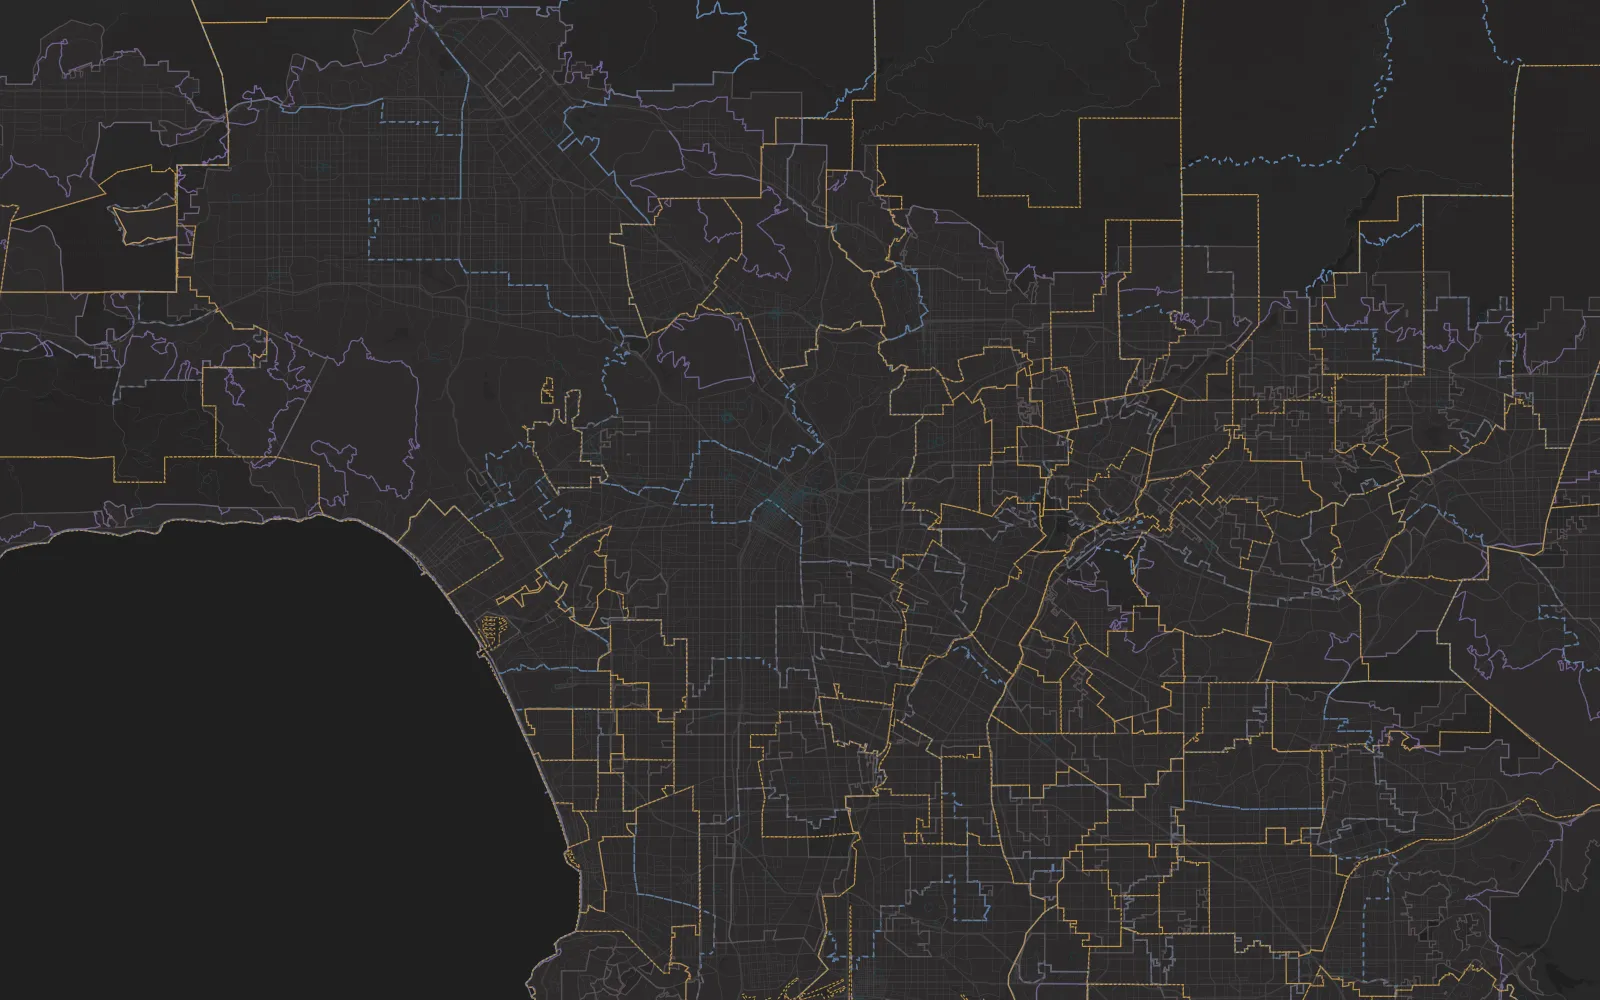
Land use is vast. It is also insane.
Zoom into any metro and the map turns into circuitry. Each one of those boundaries is its own jurisdiction — a district where the setback, the height limit, the parking ratio, and the permitted uses all change the instant you cross the line. A single county can carry hundreds of them. The country carries millions.
And the rules themselves read like a prank. Parking minimums that mandate more asphalt than building. A use that’s by-right on one side of a street and banned on the other. Overlays stacked on overlays stacked on a base district. A state statute that preempts the city code you just spent an hour reading — so the answer on the page is wrong, and nothing tells you.
None of it is queryable. It lives in scanned PDFs, in Municode portals, in GIS servers that time out, in ordinances a council amended three years ago and never re-published. The agents read all of it anyway, and kept reading.
A note on the maps
If you landed here from an old atlas or zoning link — that’s on purpose. The live, interactive maps were the experiment’s output, not its point. We’ve folded the public viewers away and kept the research. The corpus is the asset; the map was just the proof that agents could build it. What comes next lives inside the tools we actually ship.
Who does the hard part
Running this as an experiment is one thing. Doing it for real — keeping parcel boundaries and zoning current across every jurisdiction in the country, every week, forever — is a different and much harder job. That isn’t a weekend agent run. It’s a company, and a relentless one.
Two of them do exactly that, at national scale: Regrid, which maintains nationwide parcel data, and Zoneomics, which maintains zoning data across thousands of jurisdictions. They do the unglamorous, never-finished part — the maintenance — so everyone downstream doesn’t have to. TestFit partners with both.
Our experiment proved an agent fleet can map the whole stack once. Regrid and Zoneomics prove the harder thing: that it can be kept true — at scale, forever.
What proptech still doesn’t do — and what I want next
Here’s the part that keeps me up at night. Once you’ve seen the entire regulatory stack in one place, the holes in every existing proptech product become obvious. The data exists. Nobody has made it answer a question. I want:
- A state-level override API. One call: given this parcel, what does state law force the jurisdiction to allow? ADU mandates, parking-minimum bans, multifamily-by-right (Texas SB 840 and its cousins). We mapped 410 of these rules. Nobody exposes them as an endpoint. They should be a function call, not a memo from your land-use attorney three weeks later.
- FAA control points. Part 77 imaginary surfaces — the invisible cones over every runway that cap how tall you can build for miles around an airport. We derived them from runway geometry. Most proptech pretends airspace doesn’t exist. It absolutely does, and it kills deals after you’ve already paid for the dirt.
- Building-code adoption as data. Which code year, which local amendments, which jurisdiction — as an API, not a phone call to the building official.
- A regulatory timeline. Zoning is not static. When did this overlay attach? When does that preemption take effect? You should be able to scrub a jurisdiction’s legal history like a video.
- One spatial substrate. Counties, tracts, parcels, districts, airspace, flood zones, the grid — all the same kind of object, linked at the seams, so “what applies here” is a single query instead of ten browser tabs and a prayer.
And many, many more. Every week of this experiment turned up one more thing the industry simply doesn’t have.
The point
The experiment was a massive success — not because the map is pretty, but because it proved that the most tedious research in all of real estate can be done autonomously, at national scale, and kept current. The regulations are vast and insane. That is precisely why they should be machine-readable.
We’re going to keep building toward that.
— Clifton & Claude